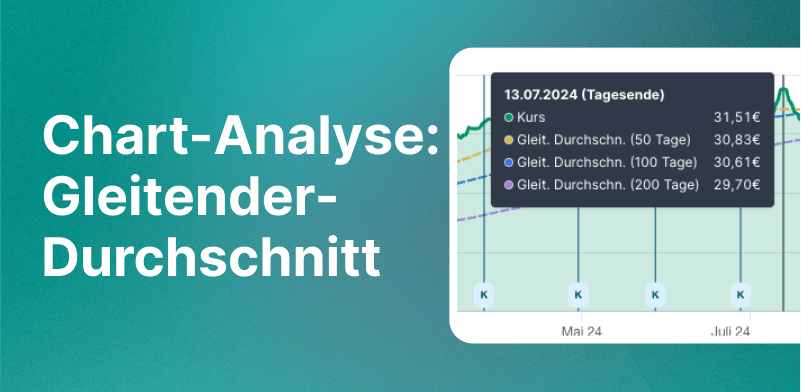
Moving Average on Holding Pages (50-, 100-, and 200-Day Lines)
We developed this feature based on community feedback. If you have ideas for new features, feel free to vote on our feedback page and help us make Parqet even better for you.
In the world of stock analysis, numerous investors use technical indicators to evaluate price movements. A particularly popular tool is the moving average. To give you even more analysis options, we have integrated a new function into the holding pages of the Parqet web app: You can now display the moving average for your securities directly in the price chart.
Sumit presented the feature in Friday Fireside starting at minute 08:16:
What is the Moving Average?
The moving average is a technical indicator that calculates the average closing price of a security over a specific number of days. This smooths out the "noise" of daily price movements and makes the overall trend more recognizable.
At Parqet, three variants are available:
- 50-Day Average: This short-term indicator helps you identify faster trends.
- 100-Day Average: Provides a medium-term perspective on price development.
- 200-Day Average: This long-term indicator is a common tool for analyzing the overall trend and identifying important support or resistance levels.
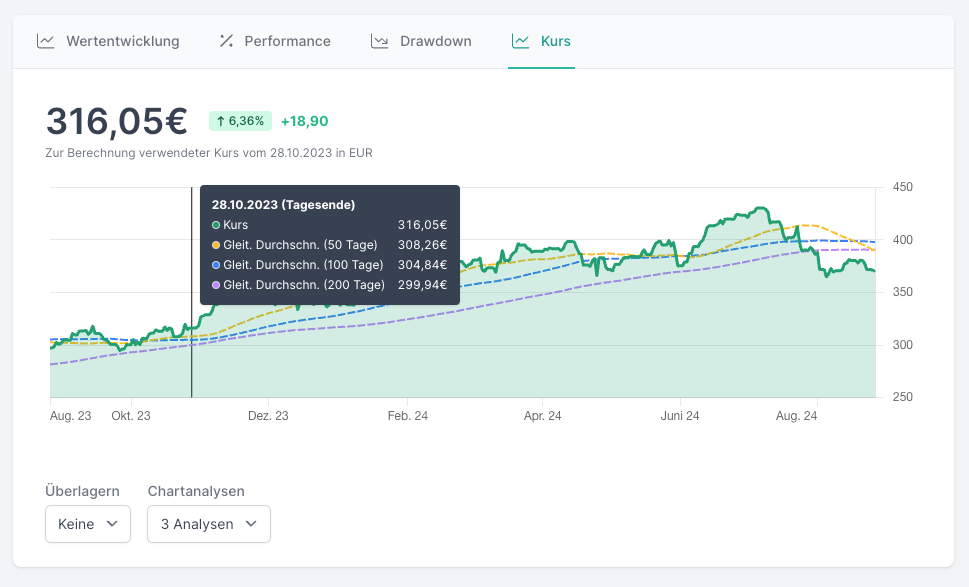
Where Can You Find the New Feature?
The new chart analysis tool can be found on every holding and asset page under the "Price" tab. Once you click on the tab, you'll see the option to overlay the moving average of 50, 100, or 200 days on the price chart. These different average values can be displayed individually or simultaneously as needed to get a comprehensive picture of price development.
The new feature is available to Plus and Investor plan subscribers and offers extended possibilities to refine your investment strategy and make more informed decisions.
Why is the Moving Average Important?
The moving average is more than just a trend line. It can help with buy or sell decisions by showing the average price of an asset over a specific period. This makes it easier to determine a tendency about the current price. Additionally, moving averages are often used to identify potential crossovers ("Golden Cross" and "Death Cross") that indicate when a long-term trend might begin or end.
Outlook and Feedback
With this new feature, we have taken another step to make Parqet an even more valuable tool for you. We are constantly working on developing more analysis tools to help you optimize your investment strategy. If you have ideas or suggestions, please let us know. Your feedback is always welcome - you can simply submit it through our feedback page.
New to Parqet?
At Parqet, we work every day to remove barriers to wealth building. We build tools that allow you to keep track of your portfolio effortlessly, whether at home or on the go.
See how Parqet can simplify your wealth planning, or create your free portfolio in seconds.
Create Portfolio